Access Type: Analytics - Viewer
The Acount Performance dashboard in Didomi CMP analytics enables your organization to view key CMP notice scope and CMP traffic scope metrics across types of consent notices. In this article, we will provide a brief overview of the data and visualizations found in the Account Performance dashboard.
- Account Performance dashboard filters
- Account Performance dashboard data and visualizations
To start, click Analytics on the left-hand panel and select the Account Performance card on the subsequent page.
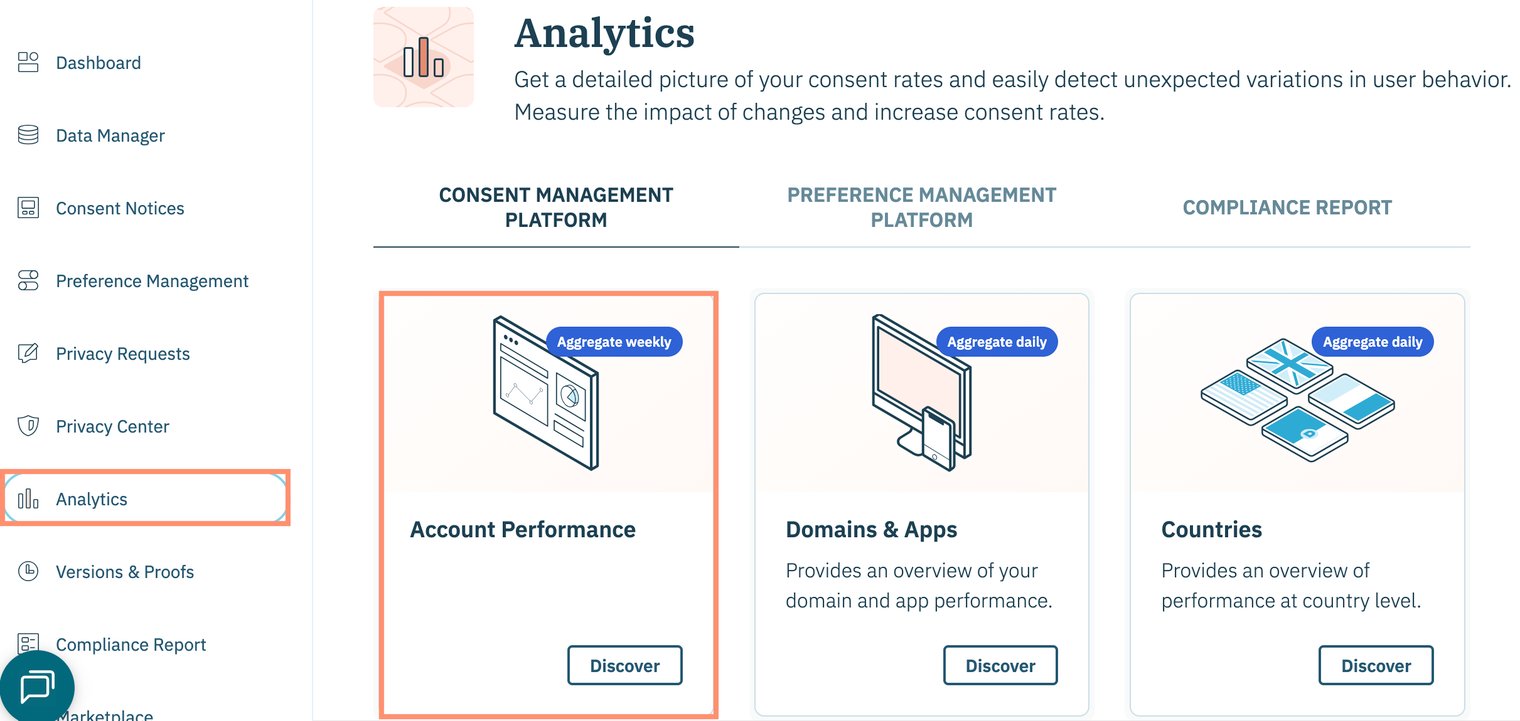
The Account Performance dashboard can also be found by clicking Dashboard on the left-hand panel.
Account Performance dashboard filters
Account Performance dashboard data and visualizations
Review the Didomi CMP metric glossary for more information on metrics found in the dashboards.
| Table/Visualization | Description |
| Notice Metric Overview |
View key CMP notice scope metrics across all consent notices (regardless of SDK, country, technology, etc...) such as:
|
| Positive Consent Rates (Notice) | View volume of all opt-ins, opt-outs, and no choices by day for the last 14 days |
| Web & AMP Metric Overview |
View key CMP traffic scope metrics across consent notices delivered on web and AMP pages such as:
|
| Positive Consent Rates (Web & AMP) | View volume of opt-in pageviews, opt-out pageviews, and no choice pageviews by day for the last 14 days |
| App & CTV Metric Overview |
View key CMP traffic scope metrics across consent notices delivered in app sessions such as:
|
| Positive Consent Rates (App & CTV) | View volume of opt-in app sessions, opt-out app sessions, and no choice app sessions by day for the last 14 days |