Access Type: Analytics - Viewer
Premium Feature: Preference Management Platform
In this article, we provide an overview of the various metrics your organization can find within Didomi PMP analytics dashboards. Generally, PMP metrics can be organized into:
- Authentication metrics
- User & choice metrics
- Purpose metrics
- Preference metrics
Note: In order to facilitate your organization's understanding of how individual metrics are calculated we encourage you to review our resources on statuses, choice types, etc...
Authentication metrics
Authentication metrics enable your organization to analyze how end-users are navigating through the authentication funnel for your PMP widgets (i.e. end-user movement from when they first authenticate to when they provide their preference selections).
| Metric/Indicator | Description |
| Auth Asked | Total count of how many times the authentication request is displayed (times authentication.asked was triggered) |
| Auth Sent | Total count of how many times the authentication request confirmation is displayed (times authentication.sent was triggered) |
| Consent Asked | Total count of how many times end-users have accessed the preferences widget (times consent.asked was triggered) |
| Choice | Total count of how many times end-users have submitted their preference selections (times consent.given was triggered) |
User & choice metrics
User and choice metrics enable your organization to analyze the overall number of end-users who are making preference submissions (choices) via your preferences widget.
| Metric/Indicator | Description |
| Users | End-users who made a preference selection |
| Total Choices | Total number of new and updated choices made by end-users |
| New Choices |
Total number of preference submissions made by end-users where a preference record was not found for the specific preferences widget Note: Please review our resource on the difference between new choices and updated choices on how these metrics are calculated. |
| Updated Choices |
Total number of preferences submissions made by end-users where a preference record was found for the specific preferences widget. Note: Please review our resource on the difference between new choices and updated choices on how these metrics are calculated. |
| AVG Choice by User | Average number of preference submission (whether new or updated) made by end-users |
Purpose metrics
Purpose metrics enable your organization to analyze how end-users are setting and changing their choices for purposes configured in your preferences widget.
Note: In order to facilitate your organization's understanding of how individual metrics are calculated we encourage you to review our resources on statuses, choice types, etc...
| Metric/Indicator | Description |
| Selected (purpose) | Total number of purposes that is selected by end-users when they give their preferences selection |
| Not-Selected (purpose) | Total number of purposes that is not selected by an end-user. The end-users have not made a choice and have never made a choice on the purpose (i.e. purpose status is null) |
| Maintained-Selected (purpose) | Total number of purposes where the previous purpose was selected and the current purpose is selected. |
| Propagation (purpose) | Total number of purposes where the previous purpose status was not selected but a child preference value was selected and the current purpose status is still not selected but a child preference value still is. |
| Denied (purpose) | Total number of purposes where the previous purpose status was not selected or selected and the current purpose status is false. |
| Maintained-Denied (purpose) | Total number of purposes where the previous status of the purpose was false and the current purpose status is false. |
| Purpose Select Rate |
Ratio of purposes selected over the total number of times the preferences widget has been answered. Purpose selection rate = selected purposes/preference choices |
| Purpose Denied Rate |
The ratio of purposes rejected over the total number of times the preferences widget has been answered. Purpose denied rate = purposes denied/preference choices |
| Activation Rate |
The ratio of opt-in purposes over the total number of preferences widget has been answered. Purpose activated rate = (Selected + Maintained_Selected + Propagation)/total choices made by users |
Refer to the example below for more information on purposes:

Purposes selection status
- In the first pref. choice:
- Purpose A is not selected but a preference is selected the purpose status is propagation
- Purpose B purpose is selected
- Purpose C is also selected even if no preference is selected below
- Purpose D is denied
- In the second pref. choice:
- Purpose A, despite not being selected, benefits from “propagation from the bottom” as child preferences have been selected.
- Purpose B is denied because its status has been changed to false
- Purpose C is maintained-selected because the purpose is still selected.
- Purpose D is maintained-denied, even if a preference value has been selected. The change in the child preference value doesn’t impact the preference status when selected or declined.
Preference metrics
Preference metrics enable your organization to analyze how end-users are setting and changing their choices for preferences configured in your preferences widget.
Note: In order to facilitate your organization's understanding of how individual metrics are calculated we encourage you to review our resources on statuses, choice types, etc...
| Metric/Indicator | Description |
| Selected |
Total number of preference values where the previous preference value is not selected and the current preference value is selected. Note: As long as a preference is selected (has a value of |
| Not Selected | Total number of preference values where the previous preference value is not selected and the current preference value is still not selected. |
| Denied | Total number of preference values where the previous preference value is selected and the current preference value is not selected. |
| Maintained | Total number of preference values where the previous preference value is selected and the current preference value still is selected. |
| Preference activated rate |
The ratio of opt-in preferences over the total number of preferences has been answered. Preference activated rate = (maintained + selected) / preference choices |
Refer to the example below for more information on preferences:
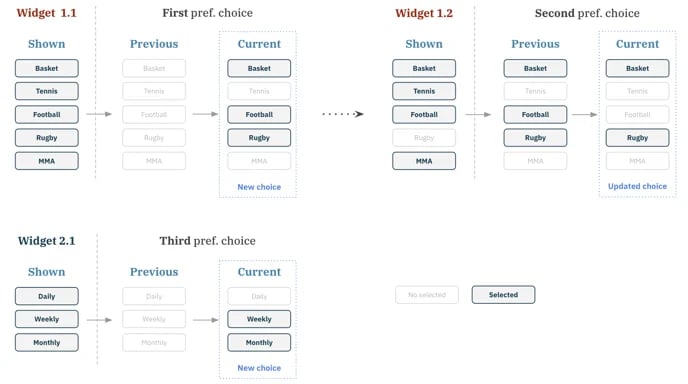
In the schema above we have 3 preference choices:
- coming from 1 unique user
- for 2 distinct widgets: widget 1 and widget 2
- widget 1 has 2 deployments/versions: widget 1.1 and widget 1.2. In widget 1.2 Rugby preference value has been removed
- All values below are preference values
Preference values selection status
- In the first pref. choice:
- Basked, football, and rugby are selected
- MMA and Tennis are not selected
- In the second pref. choice:
- Basket and Rugby are maintained
- Football is denied
- MMA is not selected
- In the third pref. choice:
- daily is not selected
- weekly and monthly are selected