Access Type: Analytics - Viewer
The App Sessions dashboard in Didomi CMP analytics enables your organization to view CMP traffic scope metrics across domains, countries, devices and operating systems. In this article, we will provide a brief overview of the data and visualizations found in the App Sessions dashboard.
- App Sessions dashboard filters
- App Sessions dashboard data and visualizations
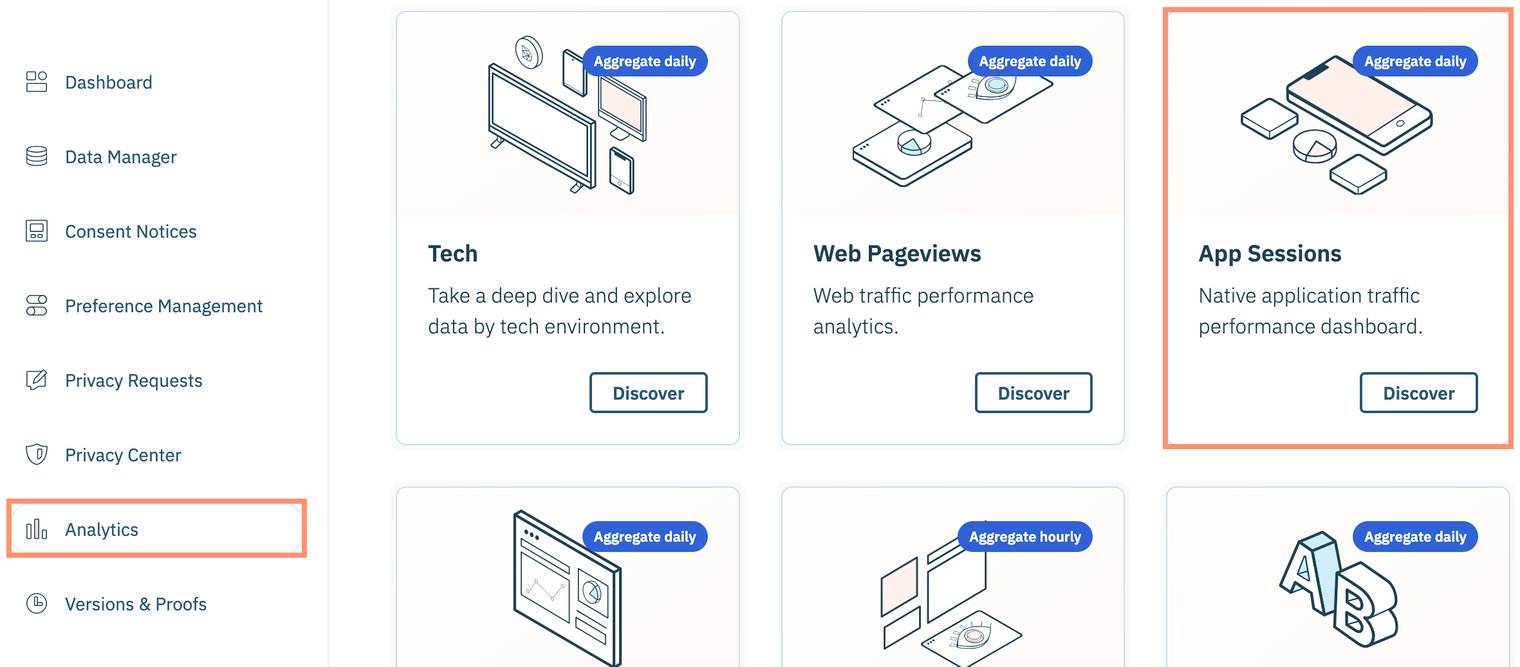
To start, click Analytics on the left-hand panel and select the App Sessions card on the subsequent page.
App Sessions dashboard filters
- Date aggregation
- Date
- Apikey
- Domain view
- Device type
- Device OS
- Platform
- Notice Name Display
- Add date to the main table
- User country
- GDPR
- Domain(s)/ App(s) (Include)
- Domain(s)/ App(s) (Exclude)
- Notice name (Include)
Click here for more information on each available filter.

App Sessions dashboard data and visualizations
The following tables and visualizations are available for the App Sessions dashboard:
Review the Didomi CMP metric glossary for more information on metrics found in the dashboards.
| Table/Visualization | Description |
| App Sessions Overview |
View key metrics across all app sessions for the configured periodization such as:
|
| Consent status over time (sessions) |
Represents the trend of key CMP traffic scope metrics (app session opt-in rate, app session opt-out rate, app session no choice rate) in the configured periodization. Note: Intervals on the line graph will be based on your selected date aggregation. |
| App session opt-in rate by domain | For each domain and device, view individual CMP traffic scope metrics such as App Session Opt-in Rate, App Session without consent, etc... |
| Consents share per platform | View how your organization's volume of opt-in app sessions per SDK contributes to your total opt-in app sessions (by percentage and volume) |
| Opt-in Rate overtime per platform |
Represents the trend of app session opt-in rates per SDK in the configured periodization Note: Intervals on the line graph will be based on your selected date aggregation. |
| Consents share per device | View how your organization's volume of opt-in app sessions per device contributes to your total opt-in app sessions (by percentage and volume) |
| Opt-in Rate over time per device |
Represents the trend of app session opt-in rates per device in the configured periodization Note: Intervals on the line graph will be based on your selected date aggregation. |
| Consents share per OS | View how your organization's volume of opt-in app sessions per operating system contributes to your total opt-in app sessions (by percentage and volume) |
| Opt-in Rate over time per OS |
Represents the trend of app session opt-in rates per operating system in the configured periodization Note: Intervals on the line graph will be based on your selected date aggregation. |
| Traffic Metrics per Country (App sessions > 1K) | Interactive map that enables your organization to visualize the overall app sessions for each country for the configured periodization |
| App Session Opt-in Rate by country | For each country, view CMP traffic scope metrics such as app session opt-in rate, app session without consent, etc... |
| Webviews Overview |
View key metrics for webview app sessions for the configured periodization such as:
|
| Webview consents share per domain | View how your organization's volume of webview opt-ins per SDK contributes to your total webview opt-ins (by percentage and volume) |
| Webview consents over time |
Represents the trend of webview opt-ins and webview opt-outs in the configured periodization Note: Intervals on the line graph will be based on your selected date aggregation. |