The Analytics feature of the CMP is now evolving offering you some new improvements and updates.
Updates from 2023-04-27
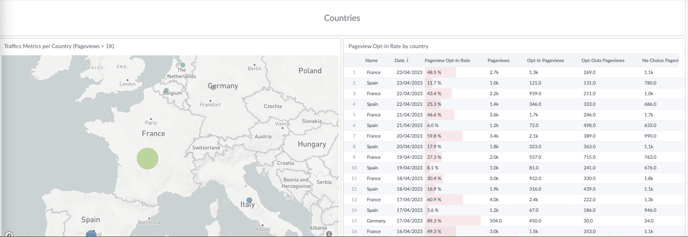
"Country" dimension added in dashboards
Two updates
- A map and a table have been added at the bottom of the traffic dashboards, namely Web Pageviews and App Sessions (example screenshot below).
- A 'Country' column has been added to the Custom Report dashboard.
The update on the Custom Report dashboard will change the format of the exported data, adding the country column in the file.
The GDPR filter
Filter change The GDPR filter has been updated to remove the United Kingdom and add Norway (NO) and Iceland (EEA country) from the list of countries that are selected when the filter is set to 'EU - Only'.
Please be aware that since the filter is applied on the fly to the data, any data that was previously exported may be affected and the results from before the filter change and after the filter change could be different.
--> The details of all the countries selected with the value 'EU - Only' are provided in this article.
Updates from 2022-11-03
Homogeneous data collection and name changes
To improve the quality of the CMP Analytics, we deployed a set of changes regarding the collection of the pageviews data and the name of the CMP metrics and indicators.
- Web data collection: standardize the data collection across all formats and environments.
- Metric & indicator name changes: improve comprehension and metrics accuracy.
Learn more about these changes in this article.
Updates from 2022-07-18
Weekly data is now Daily data
We had previously two databases/tables feeding the analytics dashboard. One with hourly data (Exploration, AB testing and Custom report dashboards) and one with weekly data (Domains & Apps, Web Pageviews, App Sessions, Countries, Tech).
Updates are the following:
- Time aggregation: daily, weekly, monthly aggregation available for all standard reports (Domains & Apps, App Sessions, Tech., Countries, Web Pageviews, Custom Report).
- Data history: one full year of data history at the aggregation level of your choice (for all the reports except the Exploration report, for which it’s two weeks).
- Data Centralization: there is only one table where all the data is centralized. One export (instead of two) with all the data for the Analytics Export.
- Filters: Country and GDPR filters are now available in the Exploration and Custom Report dashboards.
A new filter “Add date to the main table” has been added to most of the dashboards. You can look at the filter article to learn more.
Updates from 2022-04-28
Filters update
Two news filters have been added.
- Notice Name (Display)
- Notice Name (Include)
All details about these new filters in the Filters in the Analytics section article.
Notice Names in the tables
“Notice Name” has been added as a filter in the following dashboards. It also has been added as dimension/column in the main tables of these dashboards.
- Custom Report
- Domains & Apps
- Web pageviews
- App sessions
- Exploration
If there are empty values in the column “Notice Name” it’s because one or more notices have not been updated since 2021. In order to see the value notice name appears please go into the notice’s setting and “save and publish” the notice.
Updates from 2022-01-15
All reports
Filters
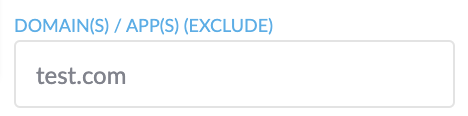
- Domain(s)/App(s) (exclude): a wider match is now available. The text is also case insensitive.
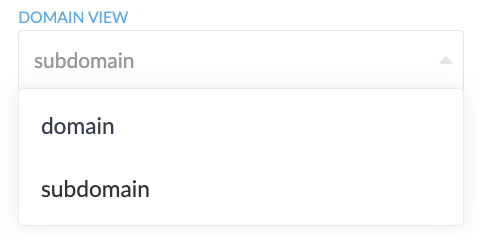
- Domain view: all the reports at domain level are adjusted accordingly. The Domain view by default is by subdomain.
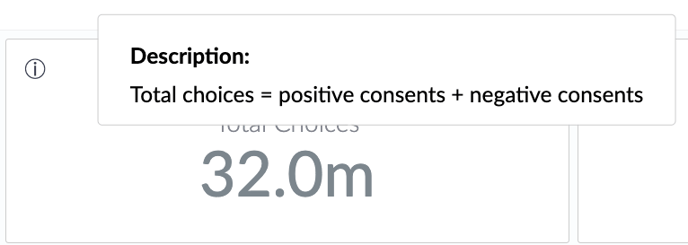
Metrics description
- The metrics description is now a formula that gives a better overview and understanding of the parameter:
New metrics
- Two brand new metrics are now available: Purposes View Rate and Vendors View Rate.
👉Purposes View Rate: Total shown purposes/Total notices
👉Vendors View Rate: Total shown vendors/Total notices
Domains and App(s)
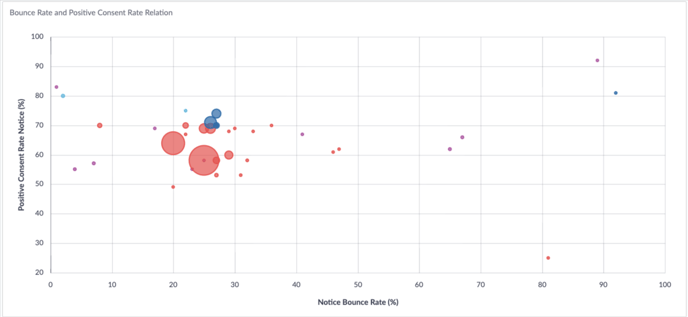
Bounce rate and positive consent rate relation
- You can hover the point to see the details of the domain position. This offers you a better overview of the domain position regarding the bounce rate and the consent rate.
- The bounce rate and the consent rate are now displayed in %, and you can see one color per SDK type.
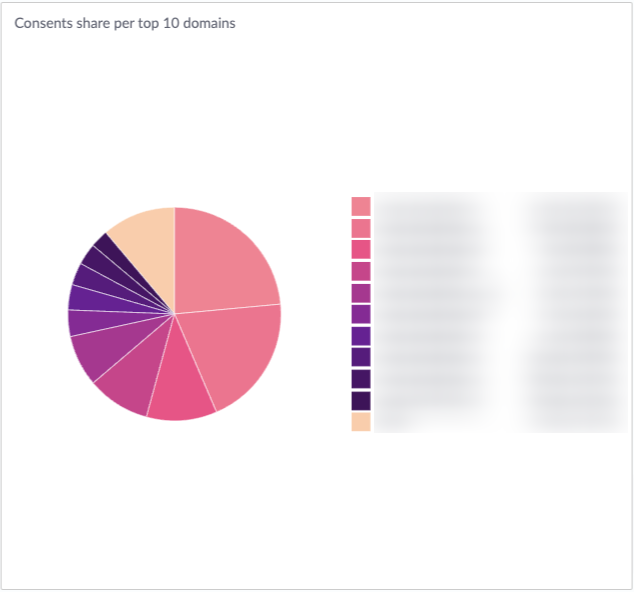
Domains
- If you have multiple domains, you have now the possibility of seeing the top 10 domains for positive consent share. It gives you more information about the consent following the domain name.
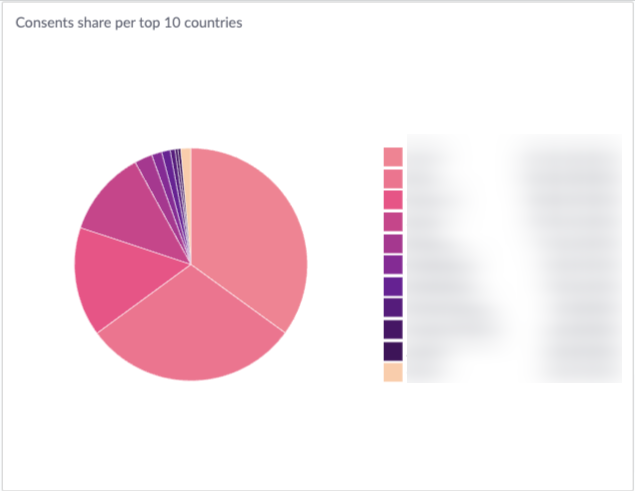
Countries
- You can now add positive consent share per top 10 countries. This gives a great overview of the consent share following your users’ location.
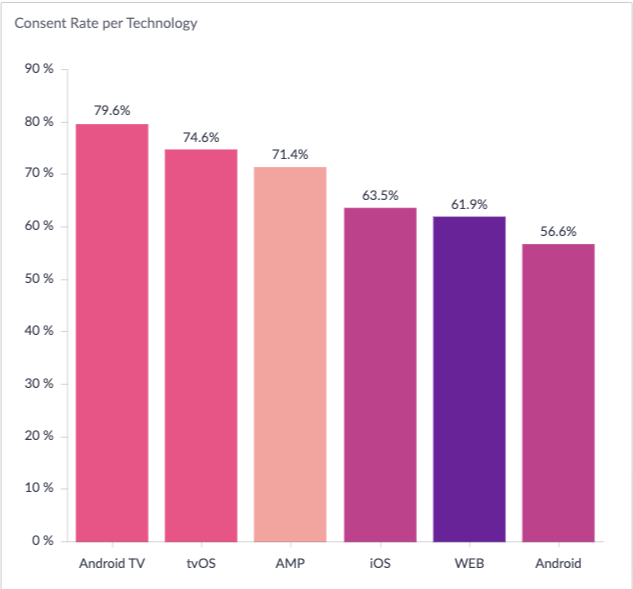
Tech
Consent rate per technology
- You now have access to the consent rate following the technology used by the user, such as: iOs, Android, Web, etc.
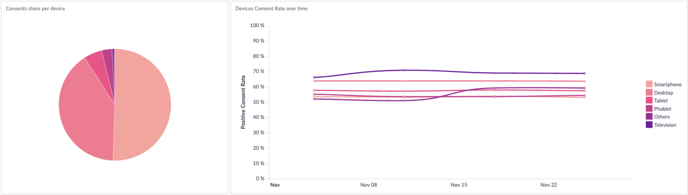
Web Pageviews and App sessions
Device
- The color code is now harmonised between the two figures, to offer a more intuitive reading. The left figure is now showing consent share by platform/device/OS and the right one is showing consent rate over time.
Custom report
You can generate your own report on a daily/hourly/weekly/monthly basis, on the following information:
- Domain inclusion
- Domain exclusion
- Platform
- Device type
- Device OS
You can add up to 5000 rows to your report. Please note that you can exclude a column and that there is no volume filter.