Access Type: Analytics - Viewer
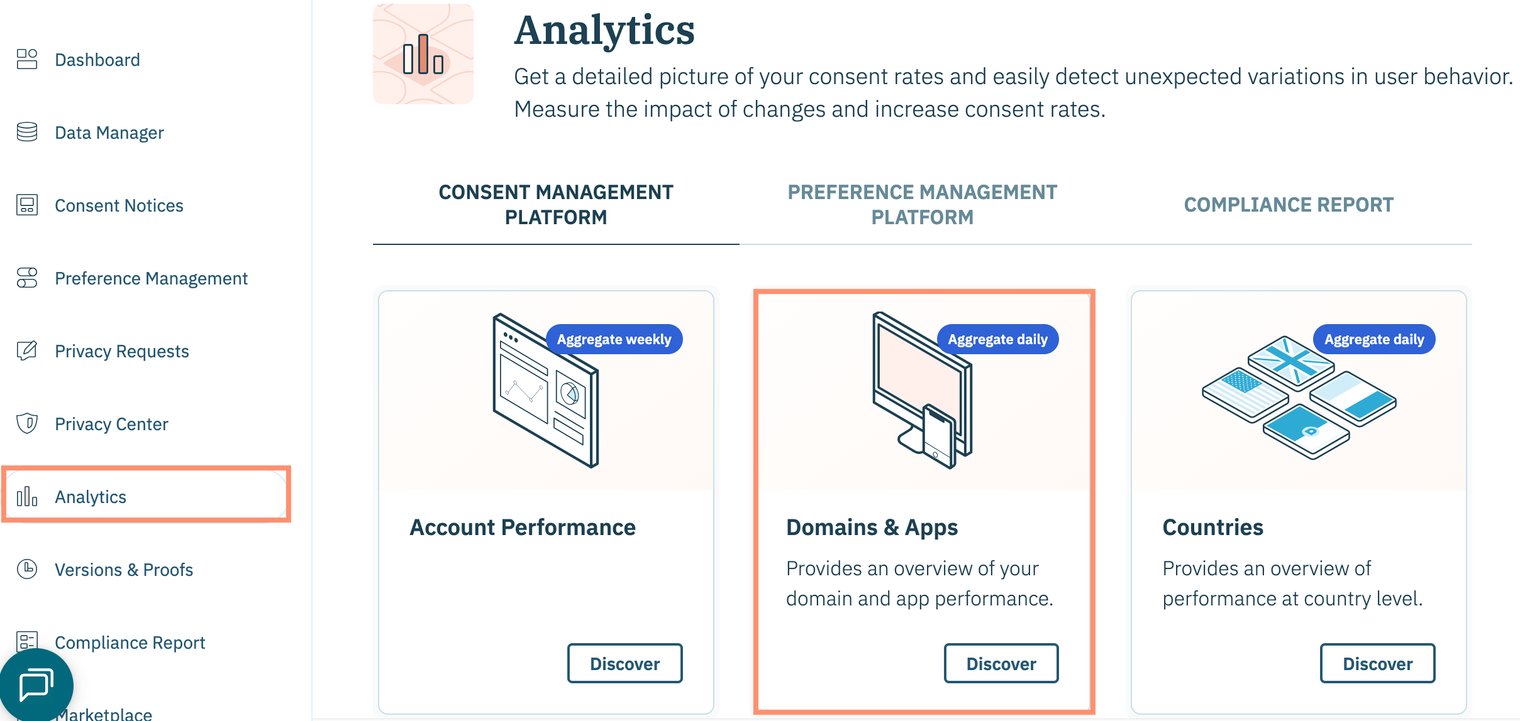
The Domains & Apps dashboard in Didomi CMP analytics enables your organization to view CMP notice scope metrics across different domains and applications owned by your organization. In this article, we will provide a brief overview of the data and visualizations found in the Domains & Apps dashboard.
- Domains & Apps dashboard filters
- Domains & Apps dashboard data and visualizations
Domains & Apps dashboard filters
The following filters are available for the Domains & Apps dashboard:
- Date aggregation
- Date
-
Apikey
-
Domain view
-
Device type
-
Device OS
-
Platform
-
Notice name display
-
Add date to the main table
-
User country
-
GDPR
-
Domain(s)/ App(s) (Include)
-
Domain(s)/ App(s) (Exclude)
-
Notice name (Include)
Click here for more information on each available filter.

Domains & Apps dashboard data and visualizations
The following tables and visualizations are available for the Domains & Apps dashboard:
Review the Didomi CMP metric glossary for more information on metrics found in the dashboards.
| Table/Visualization | Description |
| Domain & Apps Overview |
View key metrics across all domains and apps for the configured periodization such as:
|
| Consent Rate over time |
For each domain and app, represents the trend of end-user's (by percentage) who have given consent (opt-in) over all the users that have replied with a choice (opt-in or opt-out) to the consent notice in the configured periodization. Note: Intervals on the line graph will be based on your selected date aggregation. |
| Consent Rate by domains and SDK type |
View individual CMP notice scope metrics such as no choice rate, external opt-ins, etc... for each domain or app broken down by Didomi SDK Note: Table also include count for external opt-ins and external opt-outs. |
| Share of Consents (Top 10 domains) | View your organization's top 10 performing domains and apps and how their respective volume of opt-in choices contribute to your total opt-in choices (by percentage and volume) |
| No Choice Rate and Consent Rate relation (by domain) | Visualizes percentage of consent rate and no-choice rate per country |
| Consent Personalization Overview |
View key personalization metrics across all domains and apps for the configured periodization such as:
|
| Consent Personalization by domains | View individual personalization metrics such as vendors view rate, purposes personalization rate, etc... for each domain and app |