Negative No Choice pageviews and app sessions
In November 2022, traffic data updates improved accuracy but introduced a bias, slightly affecting no-choice rates and inflating opt-in/out metrics.
Context
In November 2022, we enhanced and standardized the collection of traffic data (pageviews/app sessions) and updated the calculation of traffic indicators for greater accuracy. Details of these changes are outlined here.
However, the updated calculations introduced a bias that may result in negative values for no-choice pageviews/app sessions and their rates, as well as inflated opt-in and opt-out pageviews.
Recap of the changes
Pageview status can change after consent is collected, as the tag triggers when the SDK loads. A pageview may later reflect positive consent or a consent refusal. To ensure accurate analytics, we adjust total positive and negative pageviews based on consent volumes.

To better reflect reality, we adjusted metric calculations to account for the final pageview status (opt-in or opt-out) being determined only after consent is given.
- Opt-in pageviews = opt-in pageview events + opt-ins
- Opt-out pageviews = opt-out pageview events + opt-outs
- No choice pageviews = no choice pageview events - (opt-ins + opt-outs)
Changes were implemented directly within the dashboards in November 2022. This means that when exporting data using the Analytics Export feature, you can calculate analytics either using the updated method or the "standard" method.
Bias
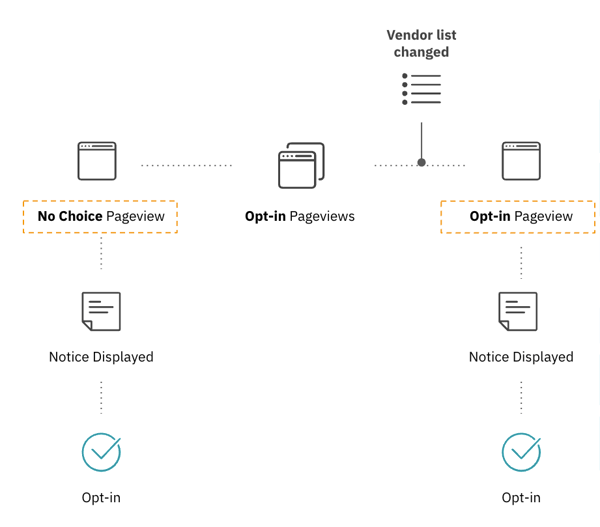
The use of consent choices to adjust pageview counts may introduce bias, influenced by external factors, during consent re-collection. In such cases, the user's "previous" consent is applied to the pageview event for the re-collection page.
This can result in the volume of consent choices exceeding the volume of no-choice pageviews. Since consent choices are used to adjust pageview counts, this may lead to negative no-choice pageviews and no-choice rates.

Key factors that increase this bias:
- Frequent changes to vendor/purpose lists
- Integration with the full IAB vendor list
- A high proportion of frequent or returning visitors
- Low traffic volumes, adding variability to the data
- Legitimate interest kept despite user’s decline in consent notices settings
Example:
In the example below, we are in a consent recollection scenario. Even if only one part of the traffic is impacted by the recollection, the adjusted no choice pageview and no choice rate indicators end up negative.

Solution
We offer an enriched traffic dashboard focused on raw data, which includes both raw and adjusted indicators.
Do not hesitate to request your Account Manager the enriched traffic dashboards:
- Enriched Web Pageviews
- Enriched App Sessions
Note that these dashboards are not available for North America dashboard. In this case, negative no-choice values are capped at 0%, and the rate will be adjusted once re-collection events are accounted for.