Access Type: Analytics - Viewer
The North America dashboard in Didomi CMP analytics enables your organization to view CMP notice scope and CMP traffic scope metrics for consent notices in the United States and Canada (whose regulations generally assume end-users are opted-into non-sensitive data processing categories unless they explicitly opt-out). In this article, we will provide a brief overview of the data and visualizations found in the North America dashboard.
Data is available starting from 2024-10-09, with no historical data provided prior to this date.
- North America dashboard filters
- North America dashboard data and visualizations
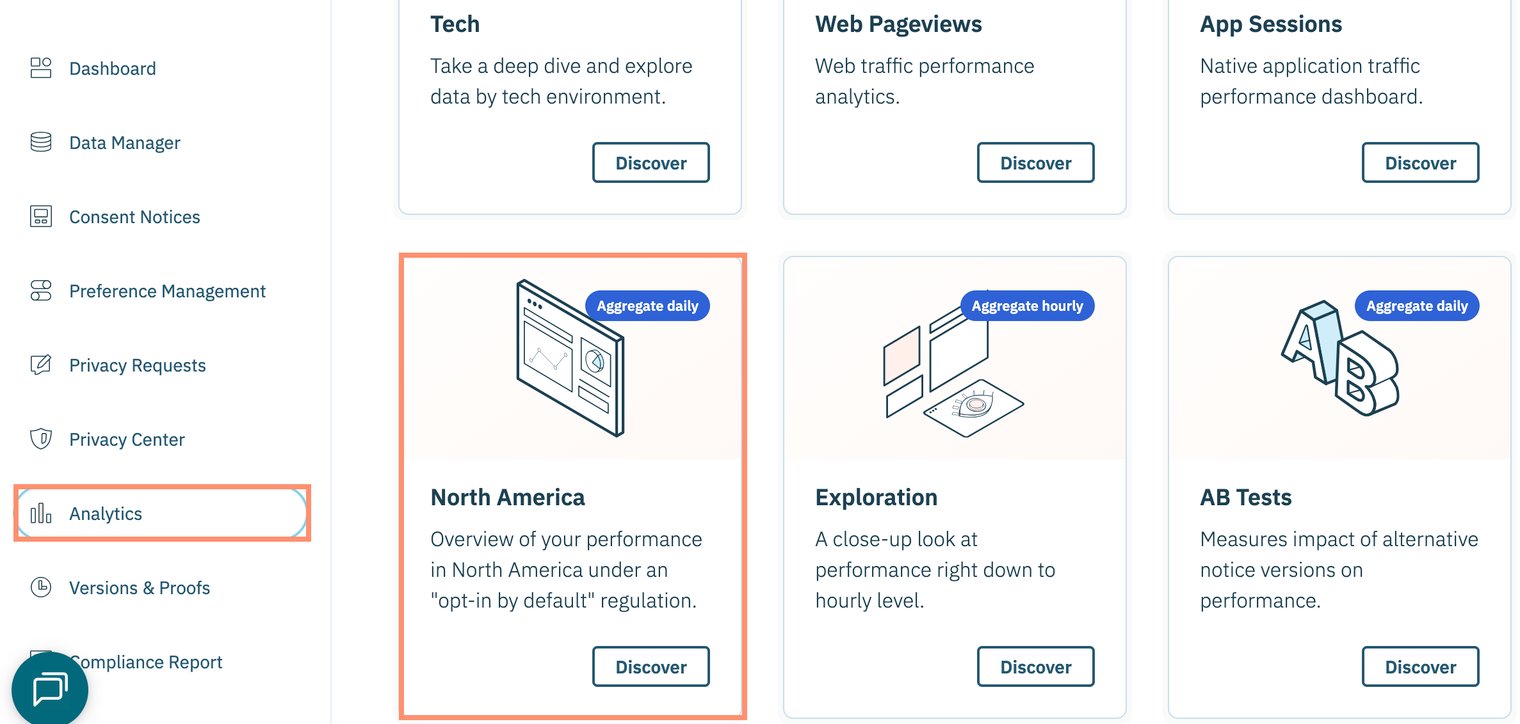
To start, click Analytics on the left-hand panel and select the North America card on the subsequent page.
North America dashboard filters
The following filters are available for the North America dashboard:
- Date aggregation
- Date
- Apikey
- Domain view
- Device type
- Device OS
- Platform
- Notice Name Display
- Add Date to the main table
- User country
- Domain(s)/ App(s) (Include)
- Domain(s)/ App(s) (Exclude)
- Notice name (Include)
Click here for more information on each available filter.

North America dashboard data and visualizations
The following tables and visualizations are available for the North America dashboard:
Review the Didomi CMP metric glossary for more information on metrics found in the dashboards.
| Table/Visualization | Description |
| Count Overview |
View key CMP notice scope metrics across consent notices for the configured periodization such as:
|
| Notice Rates |
View key CMP notice scope metrics by consent notice displays for the configured periodization such as:
|
| Traffic Rates |
View key CMP notice scope metrics by domain/app traffic for the configured periodization such as:
|
| Notice Performance |
Represents the trend of CMP notice scope metrics (opt-in rate, opt-out rate, acceptance rate) in the configured periodization Note: Intervals on the line graph will be based on your selected date aggregation. |
| Notice Acceptance Rate by Domain |
Represents trend of acceptance rate for your organization's domains and apps in the configured periodization Note: Intervals on the line graph will be based on your selected date aggregation. |
| Notice Acceptance Rate by Domain (table) | View CMP consent scope and CMP traffic scope metrics broken down by domain |
| Notice Acceptance Rate by Domain (region) | Represents trend of acceptance rate for each region in the configured periodization |
| Notice Displayed Map | Interactive map that enables your organization to visualize the overall count of consent notice displays for each country for the configured periodization |
| Notice Acceptance Rate by Domain (region) | View CMP consent scope and CMP traffic scope metrics broken down by country/region |